

Timeframe
Dec - May 2020
Big-Co Studio @ Cornell Tech
Partnership with Zillow Inc
My Roles
UI/UX Design
Product Design
User Research
Team Members
Serena YingChia Liu | Product designer
Mandy Kong | Front-end developer
Amanda | Front-end developer
Achal | Product Manager & developer
Diana | Product Manager
Shruti | Back-end developer
This project was created at Cornell Tech’s BigCo Studio partnership with Zillow where students works in an interdisciplinary team to build products that drive initiatives strategically within large companies.
Overview
Entry Point: Finding the right property was a major problem faced by the buyers, and many of them relied on the real estate appreciation values to get a sense of the growth of a particular neighborhood. However, the current information are mainly for agent or analyst which are not digestible for buyers, and only the property research phase are digitized.
Solution: A map-based visualization tool for better neighborhood research tightly coupled with the home-buying process. Users can apply their initial criteria for ideal home type along with the visualizations on top of the map results to make better decisions. Our assumption is by engaging users with such a solution would drive a higher conversion rate for Zillow’s other product offerings down the journey.
Navigate the domain
We first conducted interview with stakeholders and buyers to understand the industry, market and the current buyer’s journey.

Key Insights
key concern areas in Zillow:
The first one was to correctly identify and capture externalities within the BigCo system.
The second was to be able to create more demand for Zillow-owned home
key insights from buyers’ journey:
The biggest pain point is to find an ideal property
93% of buyers use an agent after shortlist such negotiation and close, and 90% of buyers are satisfied so we want to focus on research and shortlist phase.
Ideation
Based on the key areas of concern, we came up with 4 ideas:


We decided to choose Zillow REconn and narrowed down our challenge to:
Challenge
How might we empower home-buyers in making informed decisions in research phase?
Buying a house would be a huge investment for them and they wish to acquire all the information they can about their potential neighborhood. In addition to going through the painful process of gathering details from scattered sources and making sense out of them, they face difficulty in determining which area holds the most chances of flourishing in the near future.
User research
In our research phase, we conducted 12 in-depth interviews, survey to further identify buyers behaviors, frustrations and preferences in the research stage.


Insights

Pain Points —
Painful process of gathering information from scattered sources
Understanding the statistics of a neighborhood value are difficult
Back and forth between shortlist and neighborhood research
Buyers want to —
Make sure the house they bought are valuable in terms of appreciation value, future growth opportunities
Have an easier process to do research and valuation between neighborhood and listing
Have an easier way to compare different attributes across neighborhood
Persona
Analyzing Existing Products
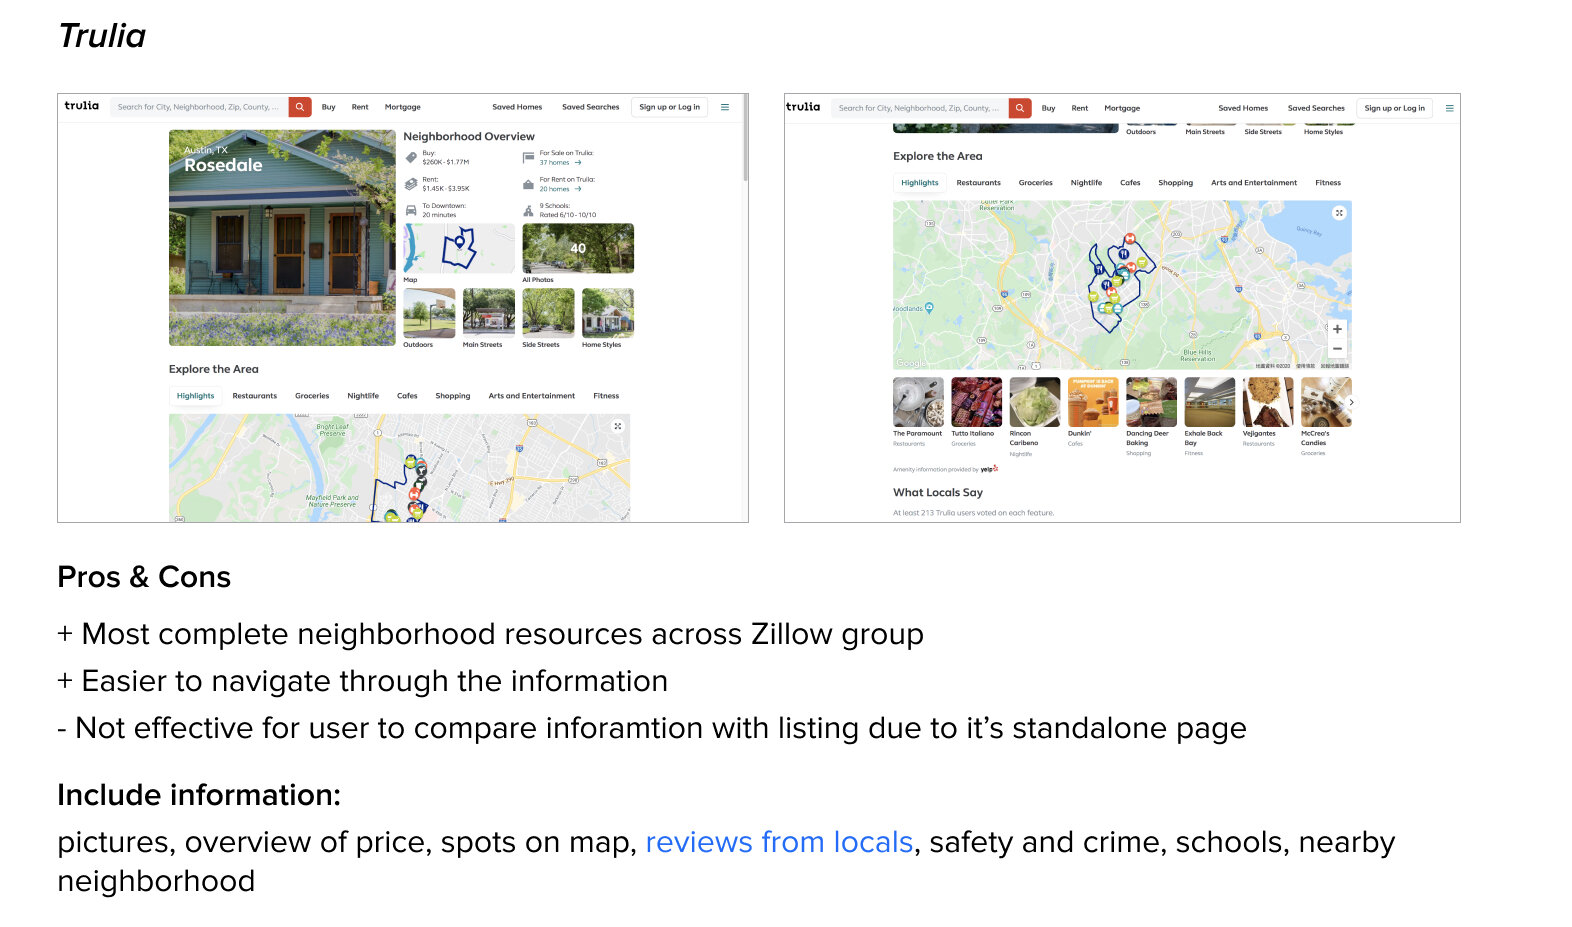
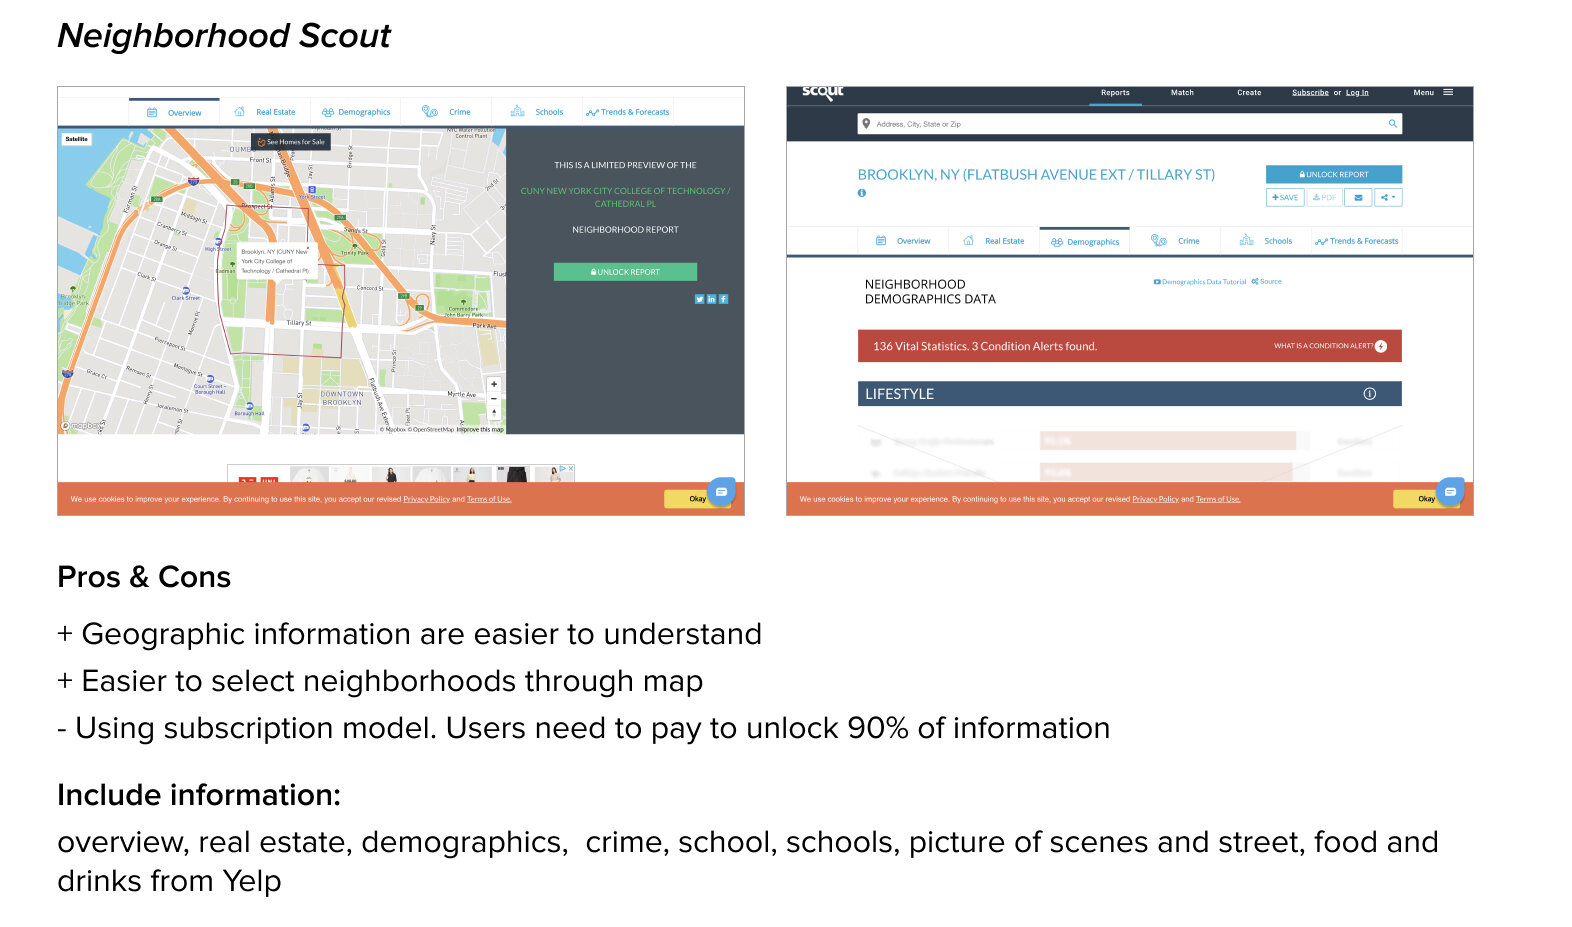
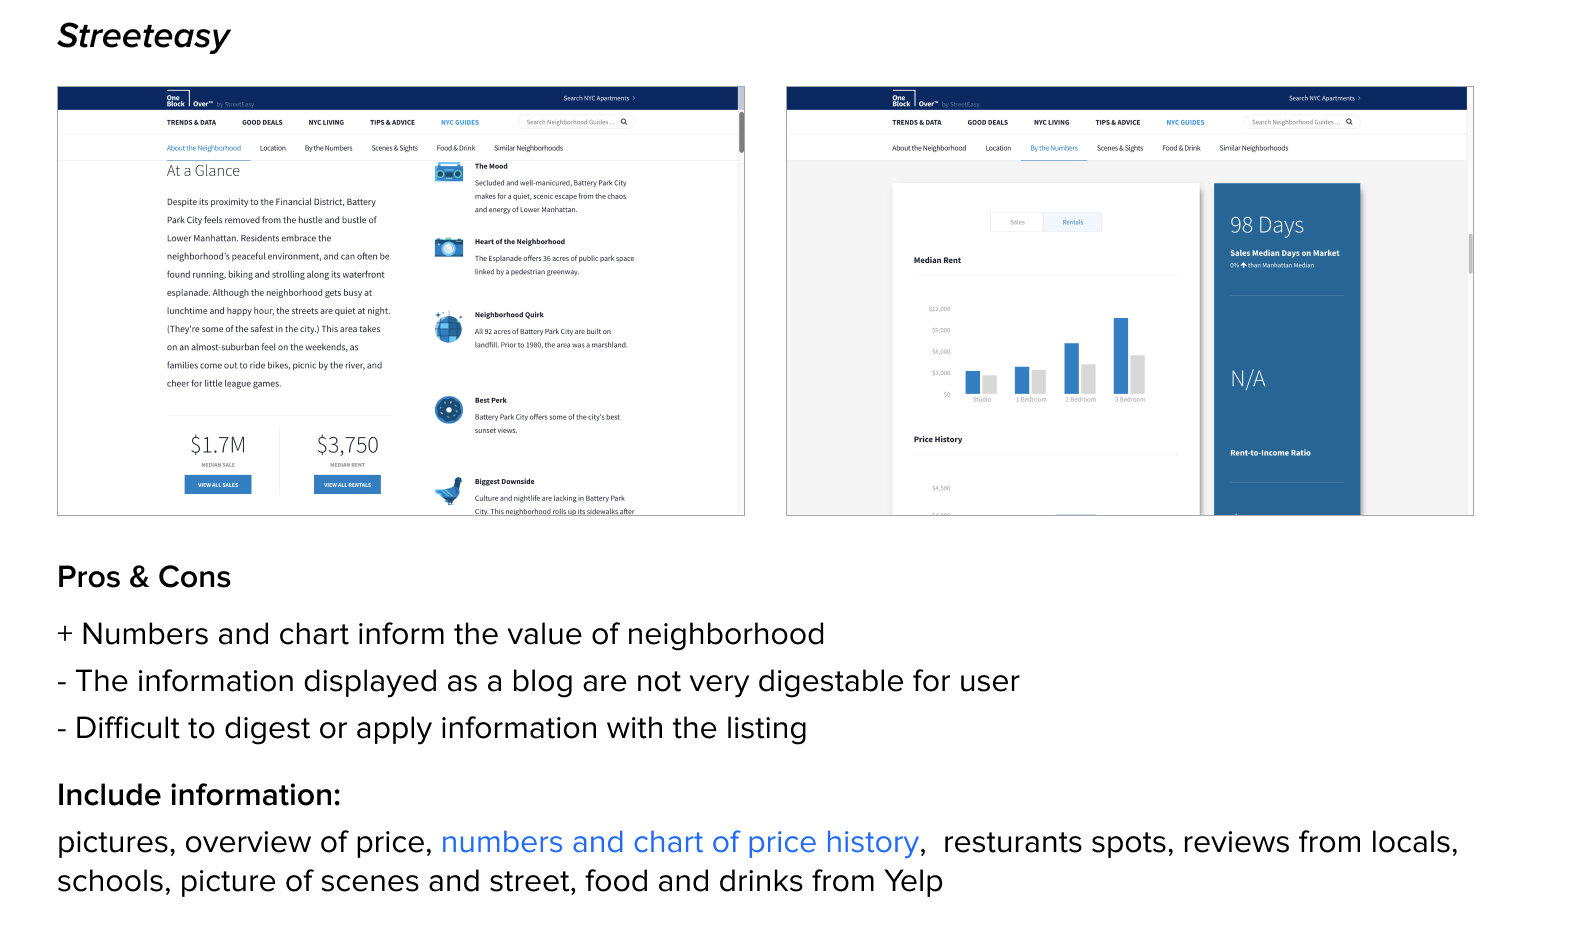
We looked into existing neighborhood researching products such as Trulia, Streeteasy and Neighborhood Scout to evaluate their usability. All of them are standalone page, resulting in low usability to compare the attributes with the listing. Besides products under Zillow group, there is an integrated neighborhood data platform called Scout, but user needs to pay for most of information.
Across the brand in Zillow group, there isn’t a resource showing appreciation value and new business data, which is crucial factor for user when it comes to analyze the value of neighborhood. As a result, we decided to go forward to focus on these data.
Solution
Introducing…

Design Requirements

Valuation and Appreciation

Heatmap of Valuation and Appreciation
Provides clearly pictures for users. Users can easily check which neighborhood has low valuation with high appreciation.
Overview of Neighborhood
Indicates the growth opportunities (Top5 rank, price/sq)

Neighborhood Information/Trend
Information includes historical analytics chart, median sale price, and return rate in next 5 years.
Compare Across Neighborhoods
Compare value of neighborhoods in one chart
New Business

Hotspot of New Business
Provides general idea of which area are highly active based on grocery store (Target, CVS, Trader Joes), and cafe(Starbucks)
Physical Location and Exact Information
Information includes store name, licensed status, and estimation of the opening time
Design Process & Iterations
Integration

Iterations

Next Steps
Long-term goal
Across Zillow Brands - Trulia, StreetEasy
Single Backend pipeline
More features (“Vibe”, pollution levels)
Next phase:A/B Testing
CTRL: Old version
VAR: New version (only appreciation and valuation)
Success Metric: - leads generated/user
Audience: NYC
Takeaway
Many processes could be digitized in the real estate industry
It's very useful to interview company employees to understand the current problems they are dealing with. Through this process, I discover there are many processes could be digitized in the real estate industry but those are mostly handled by an agent now. 90% of buyers are satisfied with agents, which makes the need to digitize those process less important for buyers. Instead, the tool can be very helpful to ease an agent’s work.
Where and how user access the tool are crucial
During designing the neighborhood research page, I have an assumption that users would like to compare the neighborhood research and a listing together. Luckily, I had a chance to interview a designer in Trulia ,which has the most complete and well-designed neighborhood research page for the users across the Zillow group. According to the interview, the current neighborhood resource page is not very effective to the user because it is a standalone page and not integrated with a listing, resulting in users leave the page soon.